Exploring the Impact of Housing Quality and Settlement Form Typologies on Heat Vulnerability in the city’s informally built areas
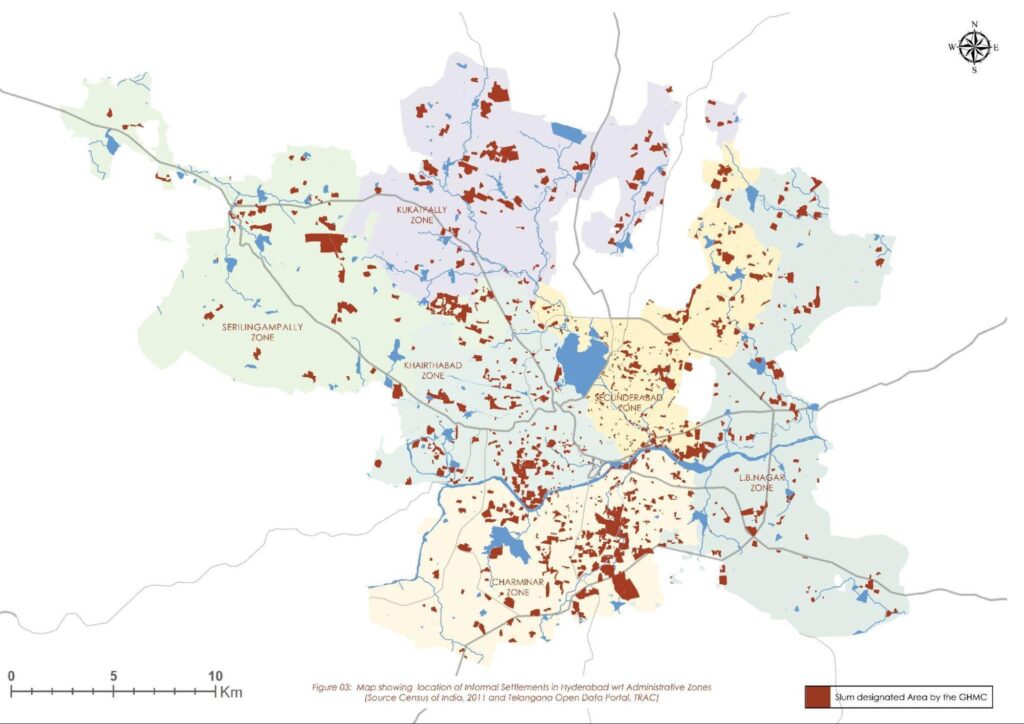
Heat and the city’s built environment intersect and interact at different scales. A granular understanding of built-environment conditions of informal settlements is required to inform interventions and policies. Current policy documents including the Hyderabad’s Heat Action Plan that targets urban heat and its impact tend to ignore this very section of the city (CPR Report, 2023). Although Heat Action Plans are devised specifically for each city so as to respond to its unique local conditions, they “fail to deal with urban specificities in any meaningful way”. Acknowledging this gap, this study aims to provide a step forward in understanding how heat manifests in Hyderabad in the informal settlements categorized as slums. This research adopts a multi-scale approach, scrutinizing settlement forms at the neighborhood level and individual housing units at the building level. For this analysis, we are using the boundaries of informal settlements as provided by the Telangana Remote Sensing Application Centre (TRAC, 2020), and the Census Wards from 2011 as our primary spatial units of analysis. According to the 2011 Census, there are a total of 150 wards, and the TRAC database identifies 1,327 informal settlements.
Methodology
This research adopts a multi-scale approach, scrutinizing settlement forms at the neighborhood level and individual housing units at the building level. For this analysis, we are using the boundaries of informal settlements as provided by the Telangana Remote Sensing Application Centre (TRAC, 2020), and the Census Wards from 2011 as our primary spatial units of analysis. According to the 2011 Census, there are a total of 150 wards, and the TRAC database identifies 1,327 informal settlements.
Methods – Sampling
Summary of input datasets for typology analysis:
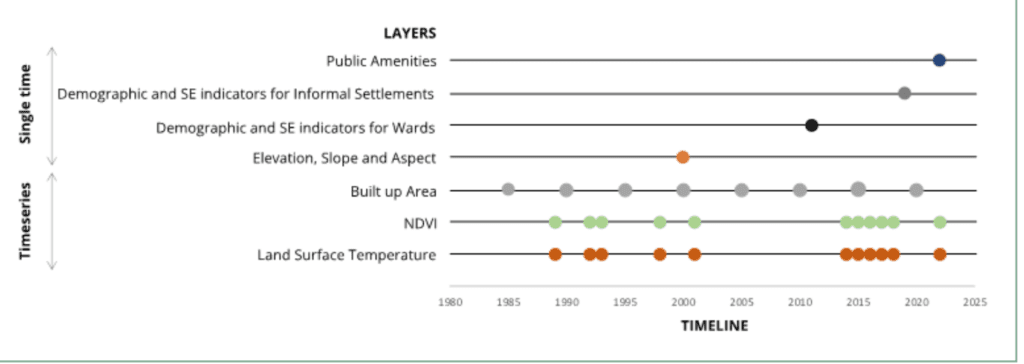
Comprehensive socio-economic, household, and demographic data are available for both of these datasets. We have integrated the following remote sensing datasets with each of the census and informal settlement boundaries:
Land Surface Temperature
Utilizing Landsat 5–8 imagery spanning from 1985 to 2023, we have computed the minimum, mean, and maximum temperatures from all cloud-free images captured during the month of May.
Normalized Difference Vegetation Index (NDVI )
Similarly, for the same imagery dates used in calculating Land Surface Temperature (LST), we have identified all pixel values with NDVI greater than 0.35, representing green cover.
Built-up land cover growth
We have obtained information on built-up land cover from the Global Human Settlement Layer (GHSL) for each 5-year interval between 1985 and 2020 to estimate built-up growth rates.
Additionally, we have derived slope and aspect data from SRTM elevation data, and we have gathered information about public amenities from the Telangana open data portal. The timeline of these datasets is presented in the figure below.
Typology identification:
We have considered the following indicators for developing the typology categories: For temperature, we have considered the highest recorded temperature in all the years. Within this range, lower values of temperature are considered better. Additionally, we have considered the temperature difference between the slum and the surrounding ward. In this context, higher differences between the ward and the informal settlement are indicative of worse conditions and disparities in living conditions compared to the surrounding neighbourhood. For NDVI (Normalized Difference Vegetation Index) we have considered the area within the spatial unit with NDVI values greater than 0.35 in 2022, the latest available imagery. The higher values signify better vegetation providing shade and cooling. Shape Index (SI) is calculated based on the area-to-perimeter ratio calculated from the informal settlement boundary polygon. Considering that a higher SI value is preferable, indicating a more regular area shape compared to a linear one. Average annual growth rate is calculated from 1985 to 2020, based on the amount of built up area within the spatial unit. In this context fast growing regions are worse off compared to older settlements which have better services and amenities compared to newer settlements. Average household size (Pop / HH), is calculated where higher values are unfavorable indicating overcrowding.
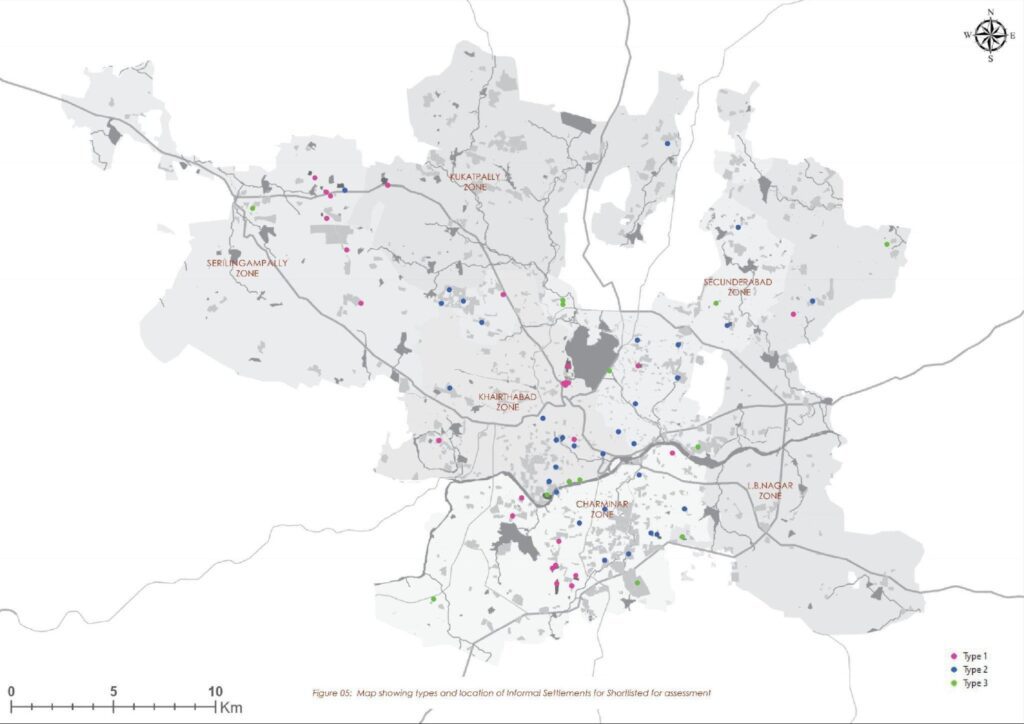
For all the above mentioned variables, we have calculated Z score to standardise and classify the variables and also to remove the outliers. We have added all the z-scores to identify the following types of settlements
- Type 1: below average or low Z-score: These settlements are most vulnerable of all informal settlements based on the above mentioned criteria.
- Type 2: Near zero Z score: These are most representative sites of all informal settlements in the city.
- Type 3: Above average or high Z-score: These settlements are relatively better compared to the other informal settlements with high score
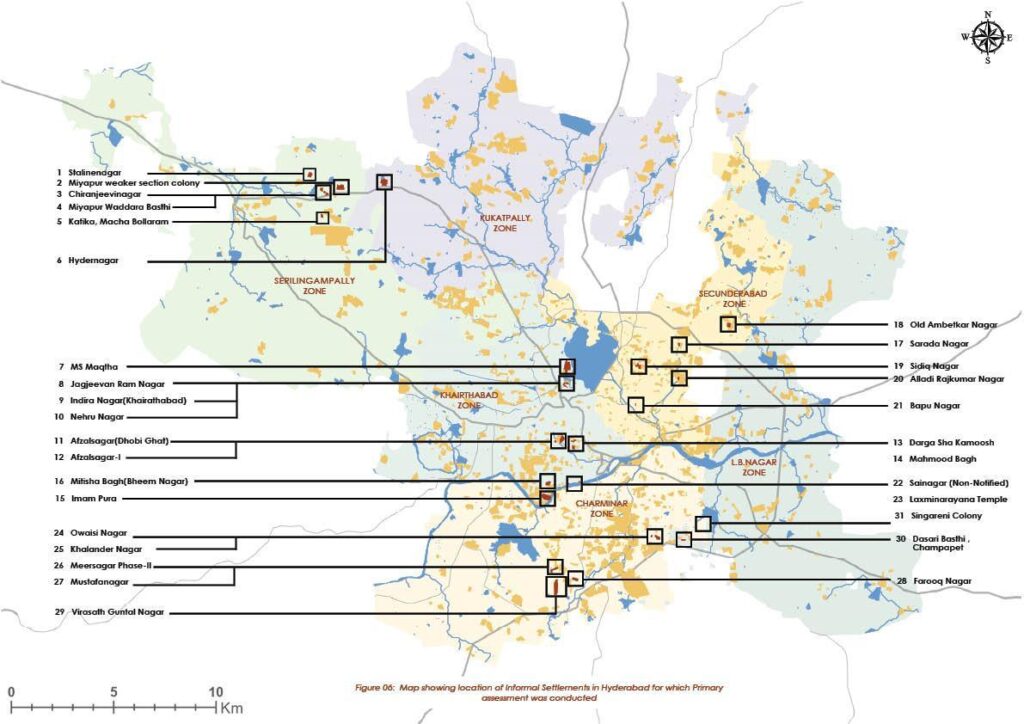
Based on the above mentioned criteria, we have identified 28 – Type 1 settlements, 32 Type2 Settlements and 13 Type 3 Settlements based on their z-scores. Figure below shows the location of the 73 shortlisted sites based on the above mentioned criteria.
Methods – Primary Assessment
The study began by selecting a representative sample of 30 slum settlements from the initial pool of 73 identified slums obtained in the first level of sampling. The slums were strategically chosen for further investigation based on the following criteria:
- An equivalent spread of z-score typologies
- Slums were selected to ensure a spread across the city, and its different administrative zones, aiming to understand the unique characteristics and features in all regions. The central zones of Khairatabad and Charminar have more number of designated slums, and settlements are older, denser, and more established. This is reflected in the field observations
- Special consideration was given to settlements located along riverbanks, water bodies, and railway tracks
Based on this, field visits were conducted to study the housing types & settlement forms with relation to heat in the sample of 31 settlements identified. GHMC (Greater Hyderabad Municipal Corporation) 2014 data is referred to for statistical information of the slums. To determine settlement forms, mapping was done on the field of building heights, built-density, road widths, street characteristics, elevations, presence of vegetation, vacant land, and land use within the settlements. To determine housing types, 3 primary aspects were observed – walls (materials, thickness, plastering if any), roofing techniques and materials, and openings (windows/ventilators number, size and materials). Beyond this, secondary aspects like presence of open/semi-open spaces in the housing units, number of stories and clustering structures were also looked at.
Extensive photo-documentation and mapping was accompanied by short interviews to capture the lived experience of heat in the area, as well as demographic makeup, prominent livelihood and occupation patterns, use of community services, historical context and other distinctive characteristics of the neighborhoods.
Settlement Morphologies
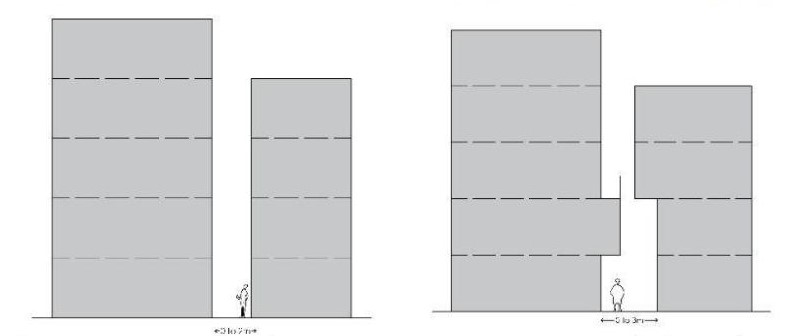
Clusters of buildings significantly influence how direct sunlight reaches the ground, how it is absorbed and in turn radiated by the built environment, and how heat is trapped between structures. The relationship between open space of streets and lanes, and building heights, serves as an indicator of the impact of mutual shading on land surface temperature. This ratio affects both microclimates and heat gain in buildings, and consequently, the experience of heat by residents of the area. Since mutual shading is a critical factor in assessing a settlement’s heat vulnerability, settlement forms are categorized into four typologies based on building heights and street widths we have discovered in this study. It is however important to note that, for more detailed analysis, the aspect ratio should be coupled with an understanding of building/street orientation with respect to the cardinal directions.
The following cases typify the prominent settlement-form typologies observed in Hyderabad:
Farooq Nagar, situated in close proximity to the Falaknuma Palace precinct, is perched on a sloping terrain, with mostly low building heights, leading to limited mutual shading effects. Due to the specific housing typology and settlement form in this area, the houses are notably vulnerable to high temperatures and prolonged heat exposure. Furthermore, the wide concrete streets within these settlements exacerbate the issue by contributing to higher Land Surface Temperatures (LST). During different months and times of the day, the amount of heat exposure to the buildings and streets is high with minimal shading. Due to the presence of courtyards, Heat can get trapped in the enclosed space, creating an atmosphere that is warmer than the exterior environment. Despite the abundant vegetation on the hilltop, which can contribute to microclimate adjustments, the neighborhood continues to experience higher temperatures.
Settlement Form A is assigned to such neighborhoods with similar built characteristics as with predominantly low building heights, and therefore minimal effect of shading. The houses here are most vulnerable to heat. Wide concretized streets in such settlements also contribute to higher LST.
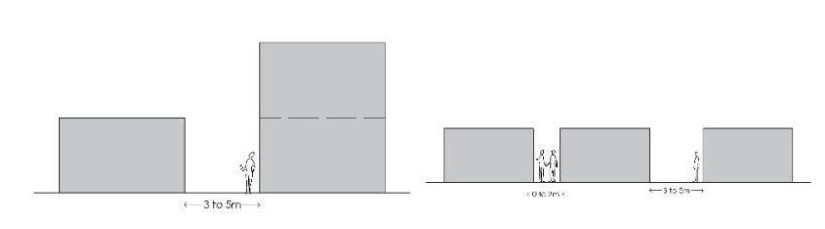
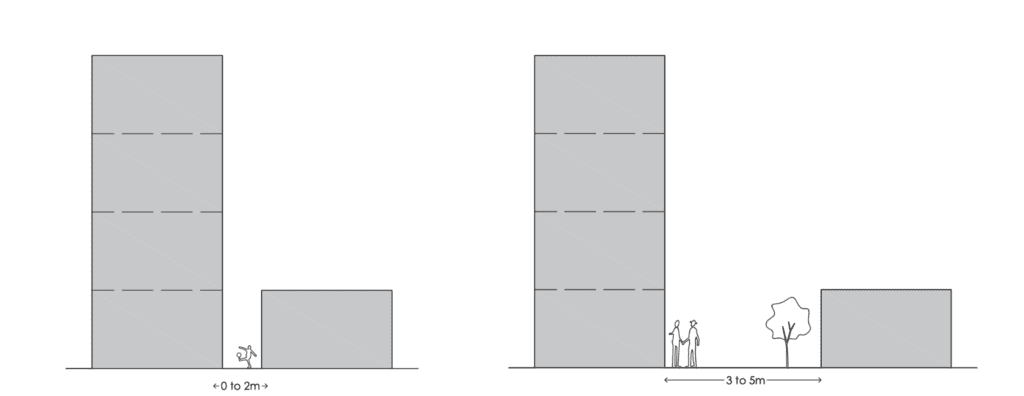
Nehru Nagar & Jagjeevan Ram Nagar colony are adjacent neighborhoods in the Khairatabad area, including semi-pukka & pukka housing. Most of the houses in slums existed previously in kuccha and were eventually reconstructed to new Pucca buildings with better facilities during the course of time. In this area, where higher buildings coexist with shorter single-story structures, mutual shading becomes a prominent outcome. The ratio of street width to building height in narrow lanes plays a crucial role in determining the extent of shading and the cooling effect. Narrow lanes, when well shaded, contribute to the creation of cool and pleasant public spaces, which can be highly valued in a warm and sunny climate. In the afternoon, as the sun starts to descend, the shadows from the taller buildings may once again lengthen, creating additional shaded spots in the streets and public spaces, especially during the midday.
Settlement Form B is assigned to neighborhoods where some building heights have started to increase but predominantly only single storey structures exist. Here, the higher buildings provide shading to some shorter ones, based on orientation. The effect of direct heat in such a settlement form is highly contextually specific, but less than in Form A.
Miyapur Weaker section Colony located in the north-western part of Hyderabad, in land which was only 20-30 years ago lying barren at the outskirts of the city. Quickly densifying with the expansion and development of the surroundings, it is now a rental housing hub for software employees, gig workers, small business owners and employees of nearby industrial outfits. The area also has a significant number of original village residents now residing in incrementally built housing: mostly masons, auto drivers and women who are domestic workers in the surrounding neighborhoods. Today, Miyapur is a weaker section colony with prominently pukka housing structures. The streets are in a grid, and plots are mostly similarly sized. The ratio of street width to building heights in lanes through the neighborhoods is quite low. Lower storeys here thus may be cool, but the lanes and streets themselves may absorb high heat through direct sunlight. lower storeys may receive mutual shading and cooling effects at certain times of the day. As the sun ascends to its zenith, the shadows become less pronounced. At this time, the narrow lanes, if well-shaded, for example with trees, continue to provide some respite from the sun’s intensity.
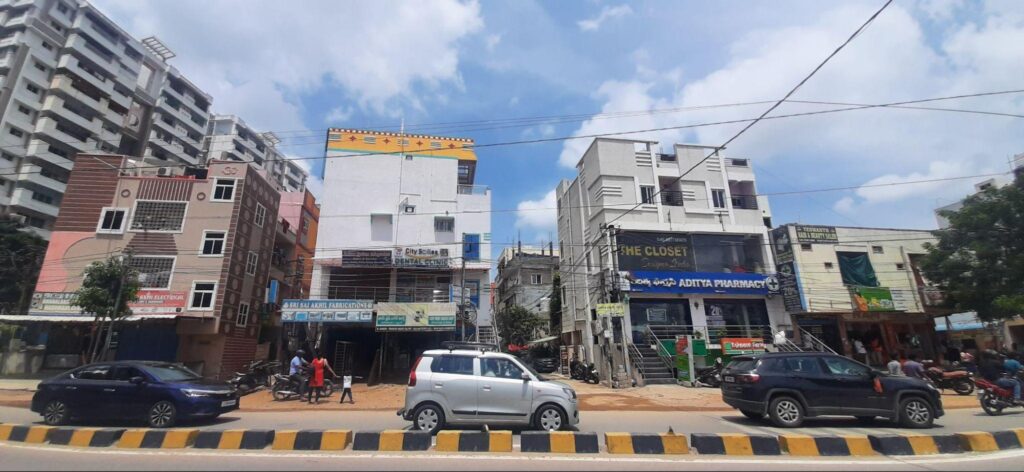
Settlement Form C is assigned to such neighborhoods with predominantly mid-rise building heights (G+3 or 4) and streets that are laid out in grids and are usually 6 to 9m wide. Here the open spaces and lower storeys may receive mutual shading and thus have a cooling effect at certain times of the day based on orientation.
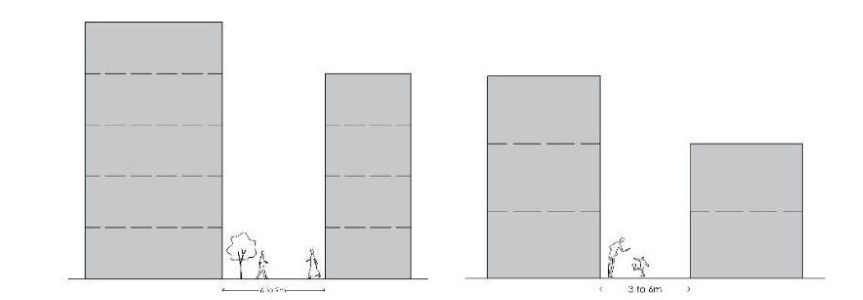
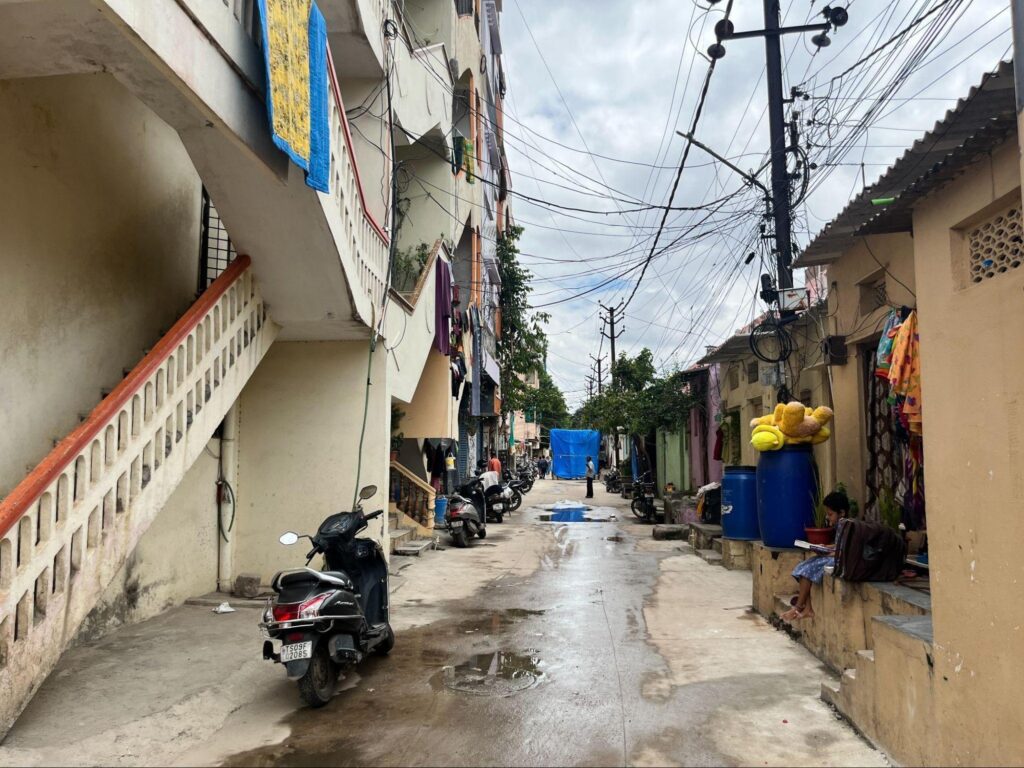
MS Maqtha is situated within the Khairatabad zone, adjacent to Necklace Road & Hussain Sagar. The vicinity is characterized by a network of narrow alleyways, roadside stalls, and curtained-off homes. In December 2017, St+Art India, the prominent street art foundation in India, mobilized a diverse group of artists from various corners of the globe to create vibrant street art within the precincts of MS Maqtha. The area features a combination of predominantly G+4 buildings and ground- floor housing, with narrow lanes measuring less than 3 meters. This creates mutual shading affecting the local temperature. Furthermore, the presence of vegetation, including areas with vegetated graveyards and lake nearby, contributes to a relatively cooler environment in the vicinity.

Predominantly composed of mid-rise buildings, often G+3 and above levels, and featuring a street layout that appears disorganized and winding, shadows play a pivotal role in shaping the settlement’s heat signature. The buildings in this settlement form are typically mid-rise with overhanging upper floors. As a result, the lower storeys and open spaces, such as courtyards, tend to remain cool throughout the day. These shaded areas can provide relief from the heat during hot weather, making them comfortable places for social gatherings and community activities. Due to the narrow and irregularly arranged streets, direct sunlight rarely penetrates the depths of the settlement. This limited access to sunlight affects both the residents and the urban landscape. It can make the streets feel dim and shaded for most of the day, particularly during the early morning and late afternoon. This results in a distinctive interplay of shadows throughout the day, creating various microclimates and affecting the overall environment of the neighborhood.
Settlement Form D is assigned to such neighborhoods with predominantly mid-rise building heights (more the G+3) and crooked streets evolved with narrow and fuzzy lanes between them that may rarely receive direct sunlight. Here the open spaces and lower storeys are quite cool throughout the day, more so where the houses project outwards on the higher floors.
Housing Types
In all typologies of settlements, it was observed that a mix of housing types exists. The building envelope materials used for roofs and walls, and ventilation all play a major role in a house’s heat gain/loss. Based on the materiality and height of the building, five typologies were identified among the visited informal settlements. To understand the vulnerability of built spaces, materiality of two major building components were looked into: walls and roofs. Alongside this, windows and ventilators were observed, as well as presence of buffer/ semi-open spaces, if any.
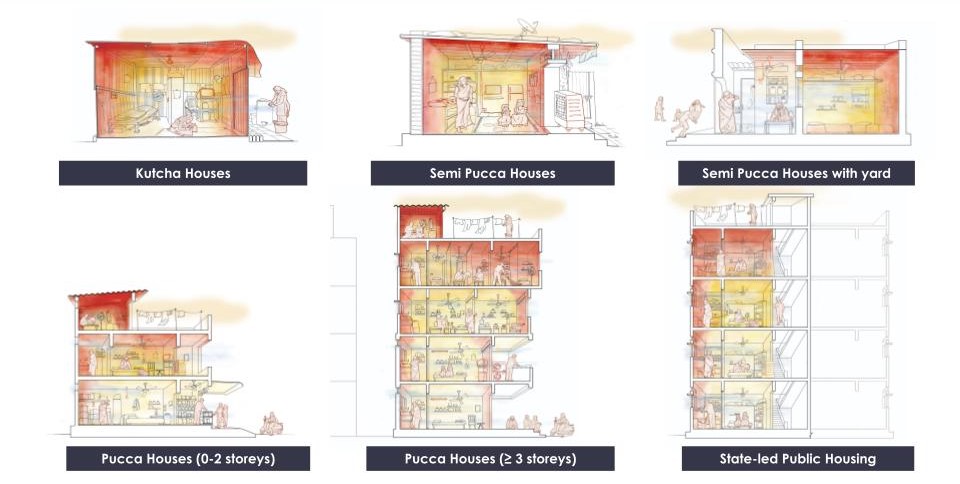
The kutcha (temporary) house typology, which may be the most precarious, also tends to be the most vulnerable to heat. Lack of a permanent structure or foundation or flooring impacts the durability of the house. For this study, it was observed that most kutcha houses were composed of the following material families:
Walls: tarpaulin sheets, Asbestos Cement (AC) sheets or Galvanized Aluminum (GA) sheets.
Roof: tarpaulin sheets, jute or plastic sacks, AC sheets, GA sheets.
Openings: Almost none, except doors. In rare cases, ventilating gaps were left below the roof.
The semi-pukka house typology is widely prevalent across the city. While they have relatively stronger, more permanent civil-work walls, the roofing is of a temporary material like GA or AC sheets. In this study, it was observed that most semi-pukka houses had no more that a couple of rooms, and were composed of the following building material families:
Walls: 4-8” thick brick or cement block walls, that are sometimes cement-plastered on one or two sides
Roof: AC sheets or GA sheets
Openings: Most with prefab cement ventilators, and at most one window.
Another common typology in the city is the semi-pukka house with a yard. Here, a small front yard space acts as a buffer zone and allows for more rooms to have windows, allowing better ventilation. A yard, as a semi-covered buffer space is also cooler than the interiors during the summer.
Walls: 4-8” thick brick or cement block walls, that are sometimes cement-plastered on one side or both
Roof: AC sheets or GA sheets
Openings: Most with pre-fab cement ventilators, and 2-4 windows, and multiple doors opening on to the yard
Pukka houses (0-2 storeys) are either load bearing or Reinforced Cement Concrete (RCC) framed structures, prevalent across the city. They have strong and more or less permanent civil-work walls and roofs. Most of these are incrementally self-built, single family homes. For this study, it was observed that most of these pukka houses were composed of the following building material families:
Walls: 4-8” thick brick or cement block walls, that are often cement-plastered on one or both sides
Roof: RCC slabs
Openings: 2 to 3 windows. Limited in row housing to just one street-facing window
Pukka houses (≥ 3 storeys) are RCC framed structures with brick/block infills, prevalent across the city. They have strong, permanent civil-work walls and roofs. Most of these are incrementally self-built structures with multiple housing units, that often include rentals. In this study, it was observed that most of these pukka houses were composed of the following material families:
Walls: 4-8” thick brick or cement block walls, usually cement-plastered on both sides
Roof: RCC slabs
Openings: 2 to 3 windows per unit. Limited in row housing to just one street facing window
State-led Public housing are generally RCC framed structures with brick/block infill walls, prevalent across the city. They always have RCC slabs for roofs and intermediate floors. For this study, it was observed that most of these houses were composed of the following building material families:
Walls: 6-8” thick brick or cement block walls, cement-plastered on both sides
Roof: RCC slabs
Openings: 2 to 3 windows per unit
Takeaways
At the outset, it must be stated that it is difficult, if not impossible to categorize informal settlements or slums into ‘typologies’. We had started with the idea of creating such typologies from the point of view of heat signatures and the experience of heat, within different types of built form and settlement morphology. In all typologies of settlements, it was observed
that a mix of housing types exists.
- Categorizing a single informal settlement as one or the other typology based on heat signatures and experience of heat is challenging due to the complex mix of built form fabrics and settlement morphologies.
- Settlements characterized by single-storeyed, low-density housing types (especially kutcha or semi-pukka) show increased vulnerability to heat stress.
- Settlements with higher density and taller built forms offer greater mutual shading, yet may act as thermal sinks, while the presence of trees and orientation of streets impact heat gain.
Lokal Habitat Labs team: Divya Chand, Shubhra Kansal, Bhavana Moturi, Shreya Moola, Ruthwik Rao | Teja Malladi (Mapsolve AI)
The authors would like to thank Swastik Harish, Angshuman Das and Anant Maringanti for their mentorship.
References
Aditya Valiathan Pillai and Tamanna Dalal. (2023). How is India adapting to heatwaves?: An assessment of heat action plans with insights for transformative climate action. CPR report
Anilkumar, Rittu, Tanaya Bhowal, Uzma Gani, Anushree Gupta, Aalok Khandekar, Goutham Raj Konda, Aarti Latkar, Anant Maringanti, Rahul Mishra, N Sai Venkata Sarath Chandra, Kiranmayi Raparthi, and Abhijit Trimukhe. 2022. City Profile: Hyderabad. Cool Infrastructures: Life with Heat in the Off-Grid City. http://dx.doi.org/10.7488/era/2181.