Abstract and executive summary
Data, simulation and analysis around heating in urban areas, especially in the Global South and even more so their informal settlements, is not commensurate with concerns about the same. While remote sensing and simulated heat island effects give us some glimpses into potential heat gains in the broader urban fabric, fine-grained neighborhood and street level data and analysis is conspicuous by its absence – given that these are key determinants of thermal comfort and its variegated psycho-social and socio-economic and cultural impact.
It is well known that building typology, in terms of its form and the materiality of its individual and combined components plays a major role in determining heat gain and associated thermal comfort within it. These properties are often used in ‘simulating’ potential heat gains from internal and external sources during the design phase of a building, for which, sophisticated tools have been developed and are available in the market.
We inquired into the use of such tools for volumetrically mapping informal or ‘off-grid’ settlements and subsequent analysis of heat gain given their particular building forms and materiality, within such neighborhood fabrics. We conduct our inquiry in Singareni Colony, Hyderabad – using Augmented Reality (AR) volumetric measurement applications, high resolution drone imagery and popular heat gain simulation software – and develop heat gain scenarios for existing forms and materiality, and for upgraded housing scenarios. We find that converting semi-pukka and kutcha houses into ‘standard’ cement concrete and brick houses will achieve less reduction in heat gain and cost-effectiveness, as compared to a scenario wherein we introduce simple insulation and high quality white roof paint to existing roofs – creating avenues for policy intervention and local practice.
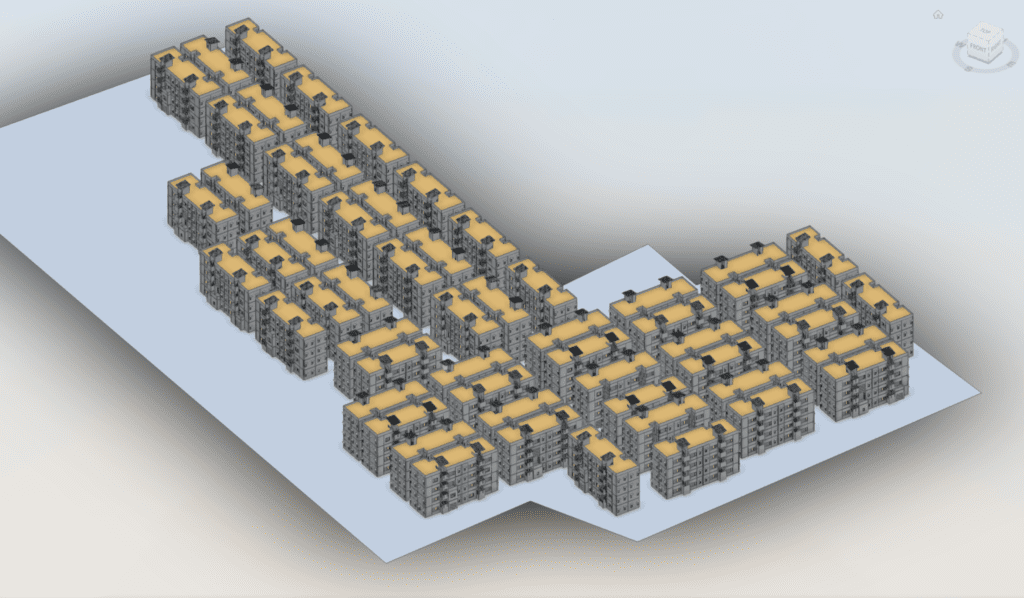
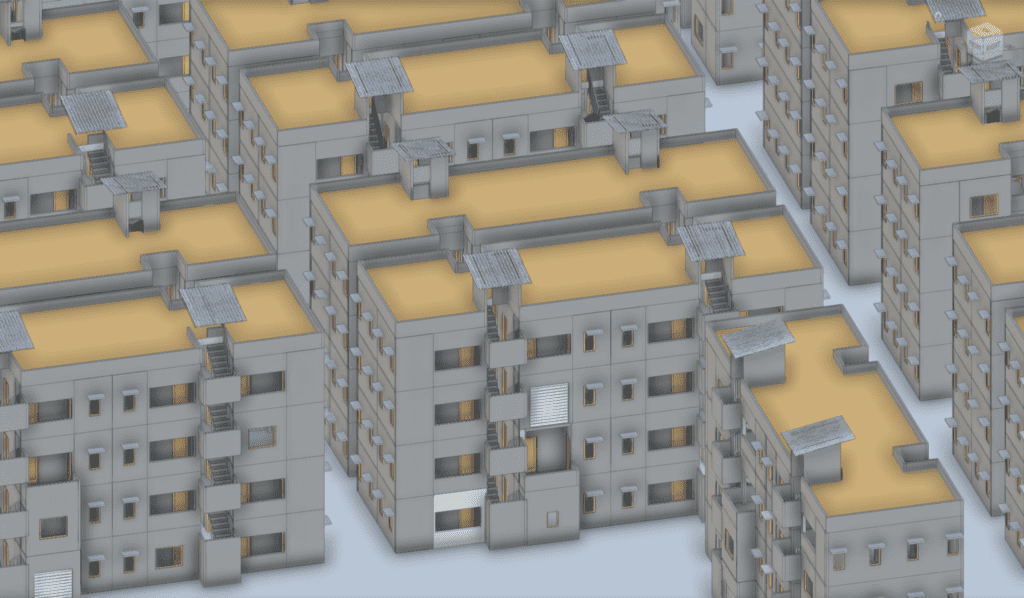
Click on the buttons below to see the 3D models of the informal settlement and the government housing at Singareni Colony, Hyderabad.
Data Collection and Integration Strategy
In order to collect data for 3-D modeling of a settlement, three (3) different methods were utilized. These are:
- Using a drone survey to generate a high resolution orthomosaic (plan) image
- Volumetric mapping of individual houses using an Augmented Reality (AR) app
- Integrating the two above on a modeling software, preferably one with Building Information Modeling (BIM) capabilities
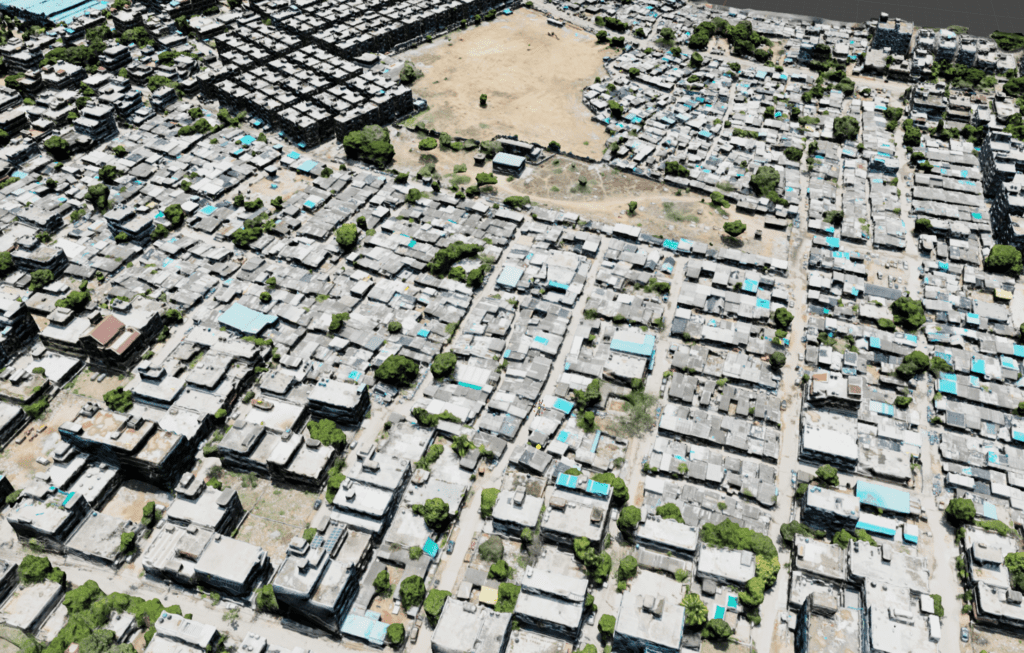
In Singareni Colony, a drone survey was conducted and orthomosaic imagery was acquired. The drone survey was conducted by flying the drone at two (2) different heights – at 50 m and at 120 m. This allowed us to generate images at resolutions of ~2.5 cm/pixel and ~5 cm/pixel, respectively. Along with the orthomosaic imagery, we were also able to generate photogrammetric data by estimating feature heights. This estimated height data, along with the orthomosaic imagery allows us to visually understand the built form of the settlement at a fine resolution. A quick view of the photogrammetric data is provided below.
Two key methods were employed to ensure adequate data fidelity for the 3-D modeling. One consisted of building the capacity of young architects and architecture students to use volumetric mapping AR apps to generate high quality content. This was implemented via a workshop conducted in Singareni Colony in May 2023, wherein we had 20 students of 3rd and 4th year of architecture from colleges of architecture in Hyderabad. This 2-day workshop familiarized these students with the AR app, the drone survey methods and the final integration on the BIM platform. Over a 2-week period in June 2023, the students accessed and acquired data from more than 260 houses in the informal part of the colony at Singareni. Another ~40 houses were estimated based on their external appearance and general building practices.
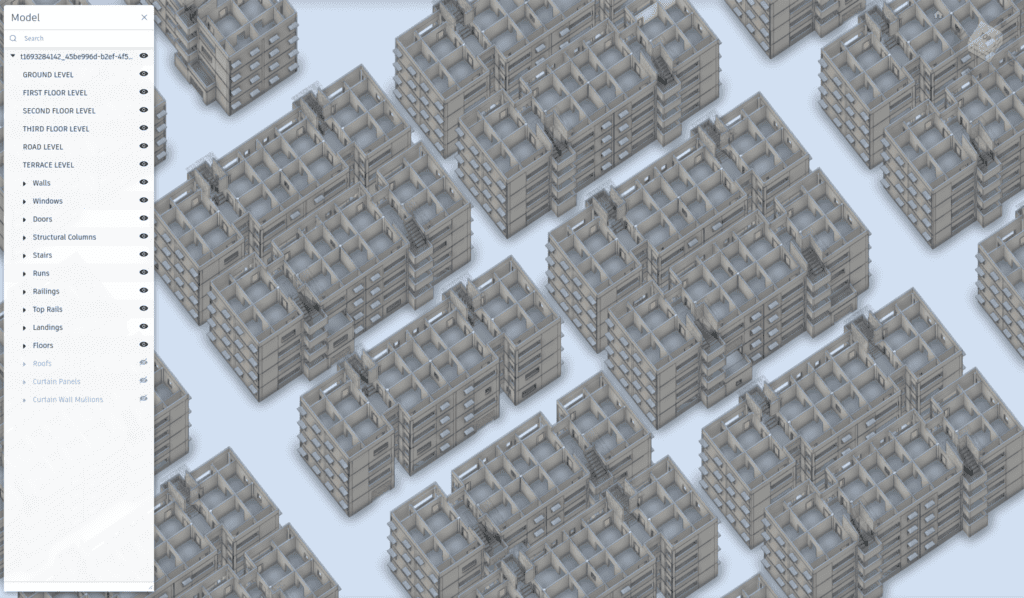
The integration on the BIM platform was validated by actual measurements taken of the houses by the students. On the BIM platform, new material families were generated, to reflect actual material practices in the houses. These include asbestos sheet roofing and new wall types such as 150 mm cement block with one-side plaster. We have also succeeded in coding in the thermal properties of the actual materials on site. The above work was facilitated by the DWC at Singareni Colony, and we had several community fellows helping with the access to various houses and involved in the drone survey.
Methods, Tools and Techniques
The following paragraphs illustrate the key advantages and challenges with each of the methods utilized:
- AR volumetric mapping: We used the industry-standard AR app ‘magicplan’ for the volumetric mapping. This app allows us to survey the interior of a house by standing in the middle of the rooms and measuring them using AR anchoring methods. The app gives quite accurate results that can be validated with some linear and diagonal measurements that are taken using legacy methods such as measuring tapes and laser measurement devices. The app also allows us to capture complex shapes and angles of the room and its walls. The main limitations of the app are:
- Inability to capture roof since it is meant for interior measurements. We are overcoming this by adding the roof with the appropriate material on the BIM platform.
- Export file. The 3-D model of individual houses is exported as an Industry Foundation Classes (IFC, which is the global open standard for BIM information exchange) version 4. However, this version is not easily accepted into proprietary BIM platforms such as REVIT. We are currently overcoming this limitation by redrawing whatever is necessary or missing.
- Drone survey: Typical sub-250 gram drones were deployed and the survey can easily be extended to other locations and sites. No major limitations are there in this method, and the overall time to survey a settlement of a certain size (Singareni Colony is about 60 acres) was a day or two.
- BIM platform (REVIT): While this is an industry-standard platform, it is highly proprietary in nature and import issues need to be addressed, as described in the section above. However, once the import issues are overcome, we are able to do the precise kind of simulations we want to achieve in this project, for example, cooling load using different cooling systems, conversion of key building materials into cool or green alternatives, sunlight modeling, etc.
At all times, it is critical to maintain a working relationship with local communities. This has been achieved through our previous experience and understanding of the settlement at Singareni Colony, via the DWC and HUL. Keeping the community in the loop on why we are doing this was an effective strategy to forestall resistance, especially since we were entering into many of the houses.
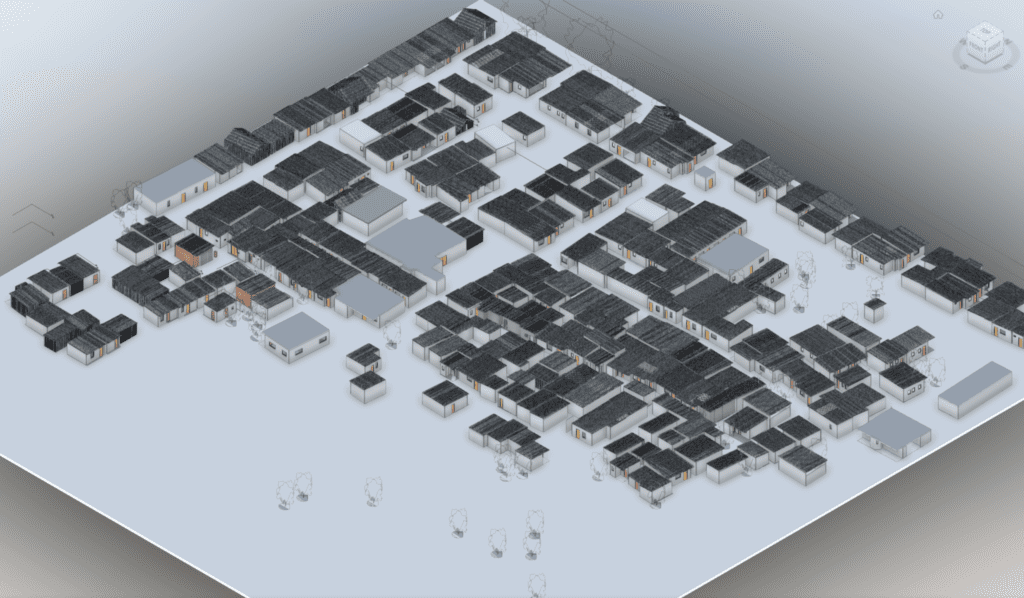
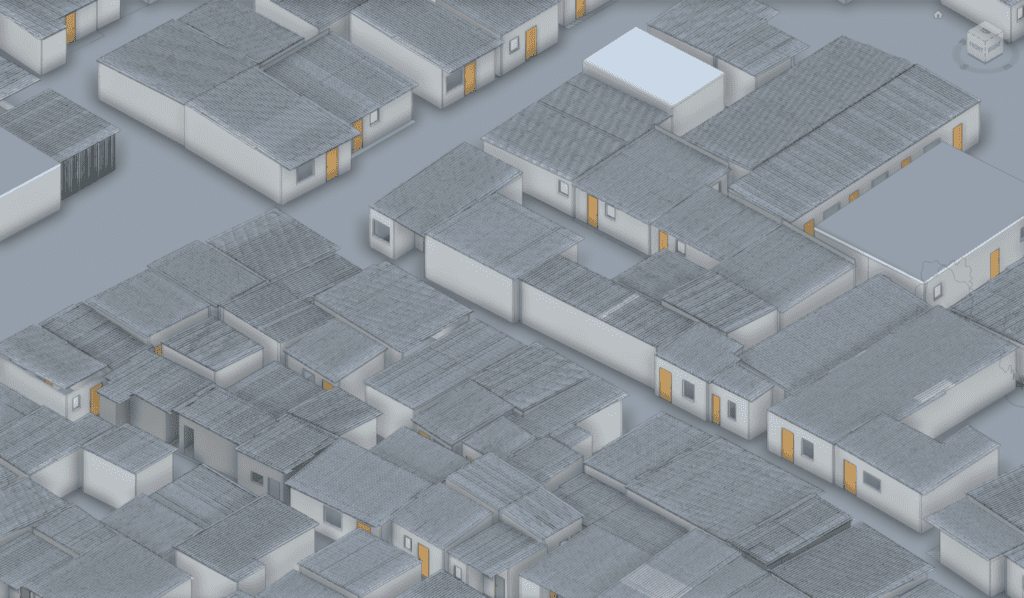
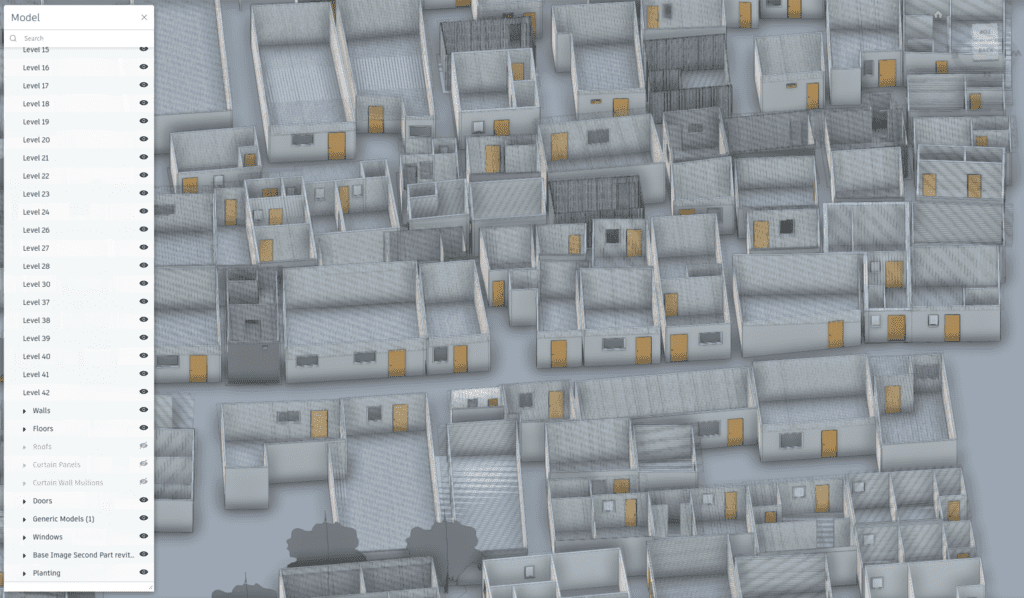
Some images from the final models (of both the informal settlement and the government housing) are shown below.
Results of Thermal Modeling for Heat Gain
We now proceed to demonstrate the usability of the model and its outputs for heat gain thermal analysis, using AutoDESK REVIT Insights program and GIS software such as QGIS. We focus the thermal modeling of the 3-dimensional settlement modeling on the question of heat gain during peak summer or days with the highest ambient temperature. The following steps summarize the method used for the analysis as well as the steps taken to visualize the results. Thereafter, an illustration of the results is presented in the form of an animated image. The following image is an animated/video file displaying the results of the simulation and thermal analysis of heat gain.
Animated visual sequence of heat gain analysis of the informal settlement at Singareni Colony, Hyderabad
The animated image contains the following sequence of steps and analytical outputs:
- The GIS shapefile of the ground floor orthometric plan of the informal settlement
- In yellow highlights, the buildings (~20) that AutoDESK REVIT was unable to delineate and analyze as ‘Spaces’
- The same as above, overlaid on the drone map of the settlement
- The buildings and spaces that were analyzed by REVIT, in yellow highlights over the drone map
- The distribution of floor areas in a spectrum from light to dark blue
- The heat gain from the roof (absolute, in Watts) in various building footprints; larger buildings have more absolute heat gain because of their larger footprint
- Roof heat gain normalized by building area, including labels for the analytical output in Watts.
Scenario Building and Analysis
Based on the model created, we are able to ascertain analytically the potential heat gain in existing buildings, given their thermal signatures. We adjust the model to incorporate material changes to some or all the buildings, and simulate the heat gain again. We have chosen to analyze two (2) scenarios:
- All the kutcha and semi-pukka buildings are retrofitted with pukka brick walls and simple Reinforced Cement Concrete (RCC) roofs; in other words, converting the colony into a pukka settlement.
- We only intervene in the roof materials of the kutcha and semi-pukka buildings, by adding a layer of insulation under them (25 mm XPS board, a relatively cheap insulation material) and also painting them with high-albedo white roof paint.
The graphs in the following page show the results of the simulation. We can clearly see that the greatest reduction in potential heat gain is in scenario 2 that thermally treats existing roofs. Moreover, this option is likely to be much more cost-effective than a full wall and roof upgrade. It must further be noted that this approach is likely more realizable using a combination of policy support and local practice and experience, as compared to a full upgrade.
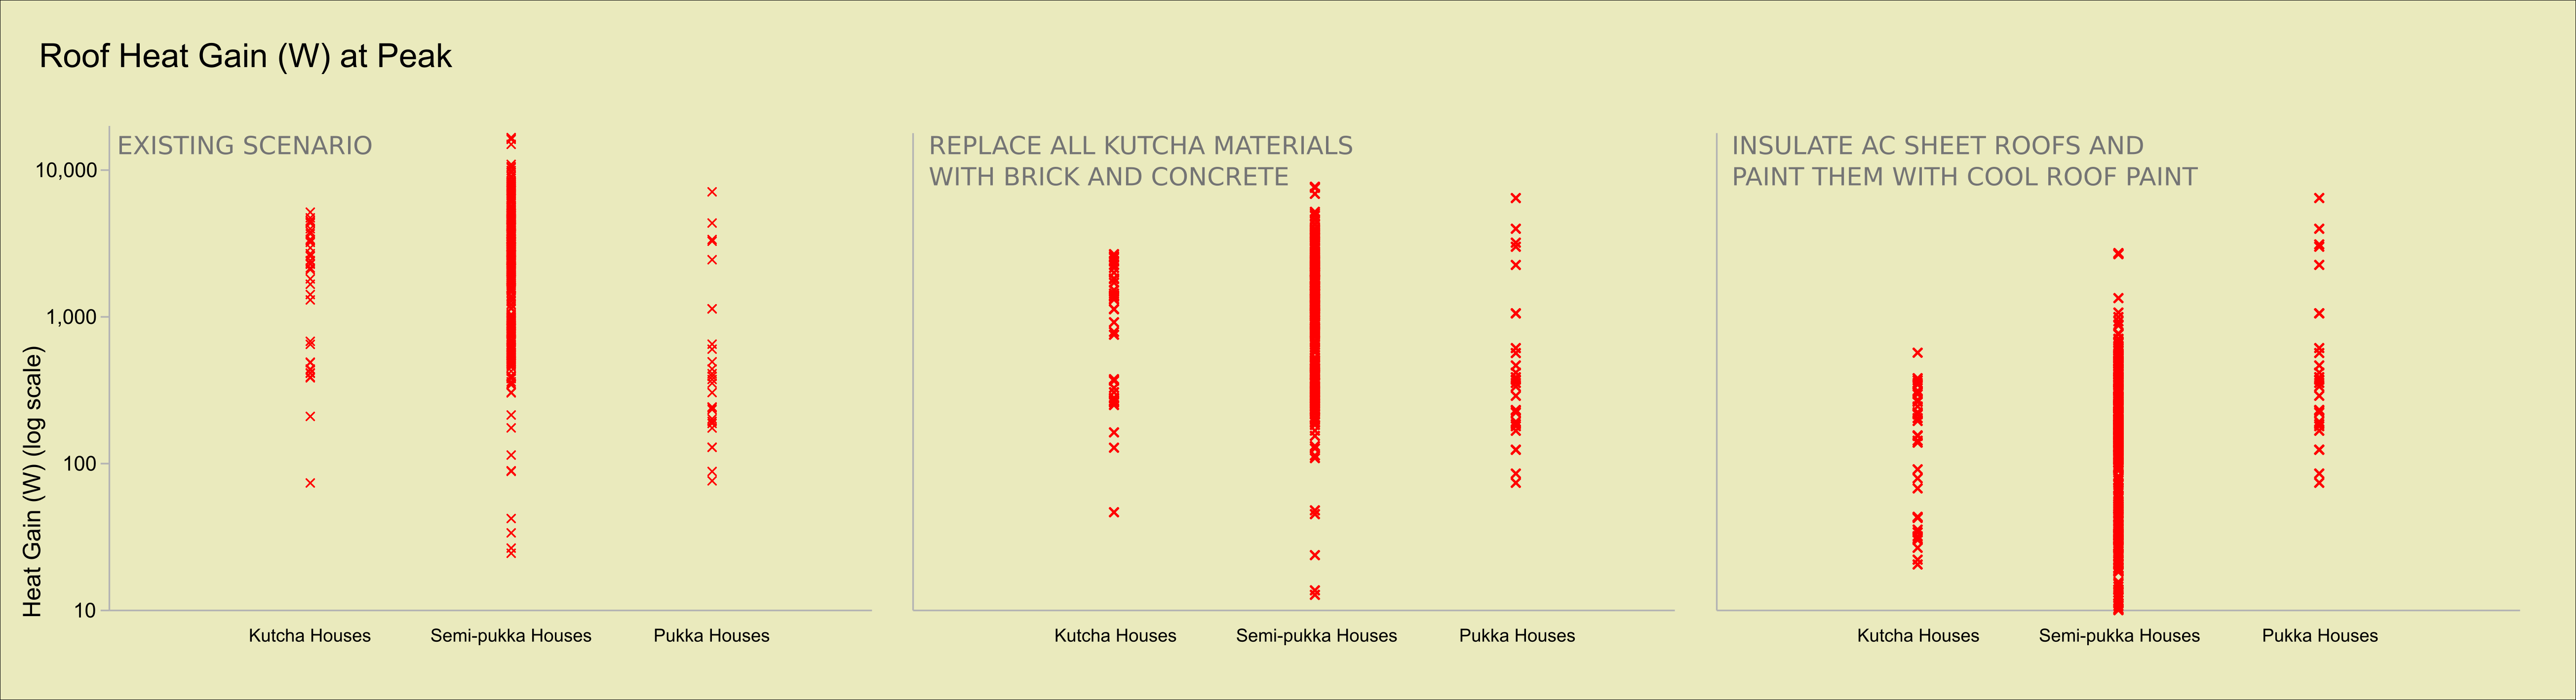
Roof heat gain scenarios by category of construction quality in the informal settlement at Singareni Colony, Hyderabad; Each point represents a ‘space’ as identified by the analytical software; Y-axis is on a log scale